
Improving user experience using Chrome Dev tools

✨2022 is here! ✨
Happy New Year guys! May this year bring you a lot of joy and success. I am enjoying writing to you guys every week and this year, I am planning to push more quality content. Let me know in the comments regarding the things you want to hear about from me!
If you are looking for someone to help you scale your website, you can connect with me on Twitter or reach out to me at dennysam14@gmail.com. Now let’s get into today’s issue.
Nothing is as frustrating as a slow loading website. In a world where we expect everything in a blink of an eye (think Zepto, UPI, Uber/Ola), why would someone with a 100Mbps internet connection wait for 10 seconds for your site to load?
If your site is slow, then you need to understand what’s causing it to slow down. Chrome’s dev tools to your help!
Chrome’s dev tools is quite popular for debugging since a long time. In my college days, I used to use it for understanding frontend coding. 7 years ago, I wrote a blog post on how I used it to increase the vote count for one of my friend who was participating in a competition. You can read about it here.
Back to Chrome developer tools, to open it, you can click on the 3 dots on the toolbar of Google Chrome. Go to More tools and click on Developer tools.
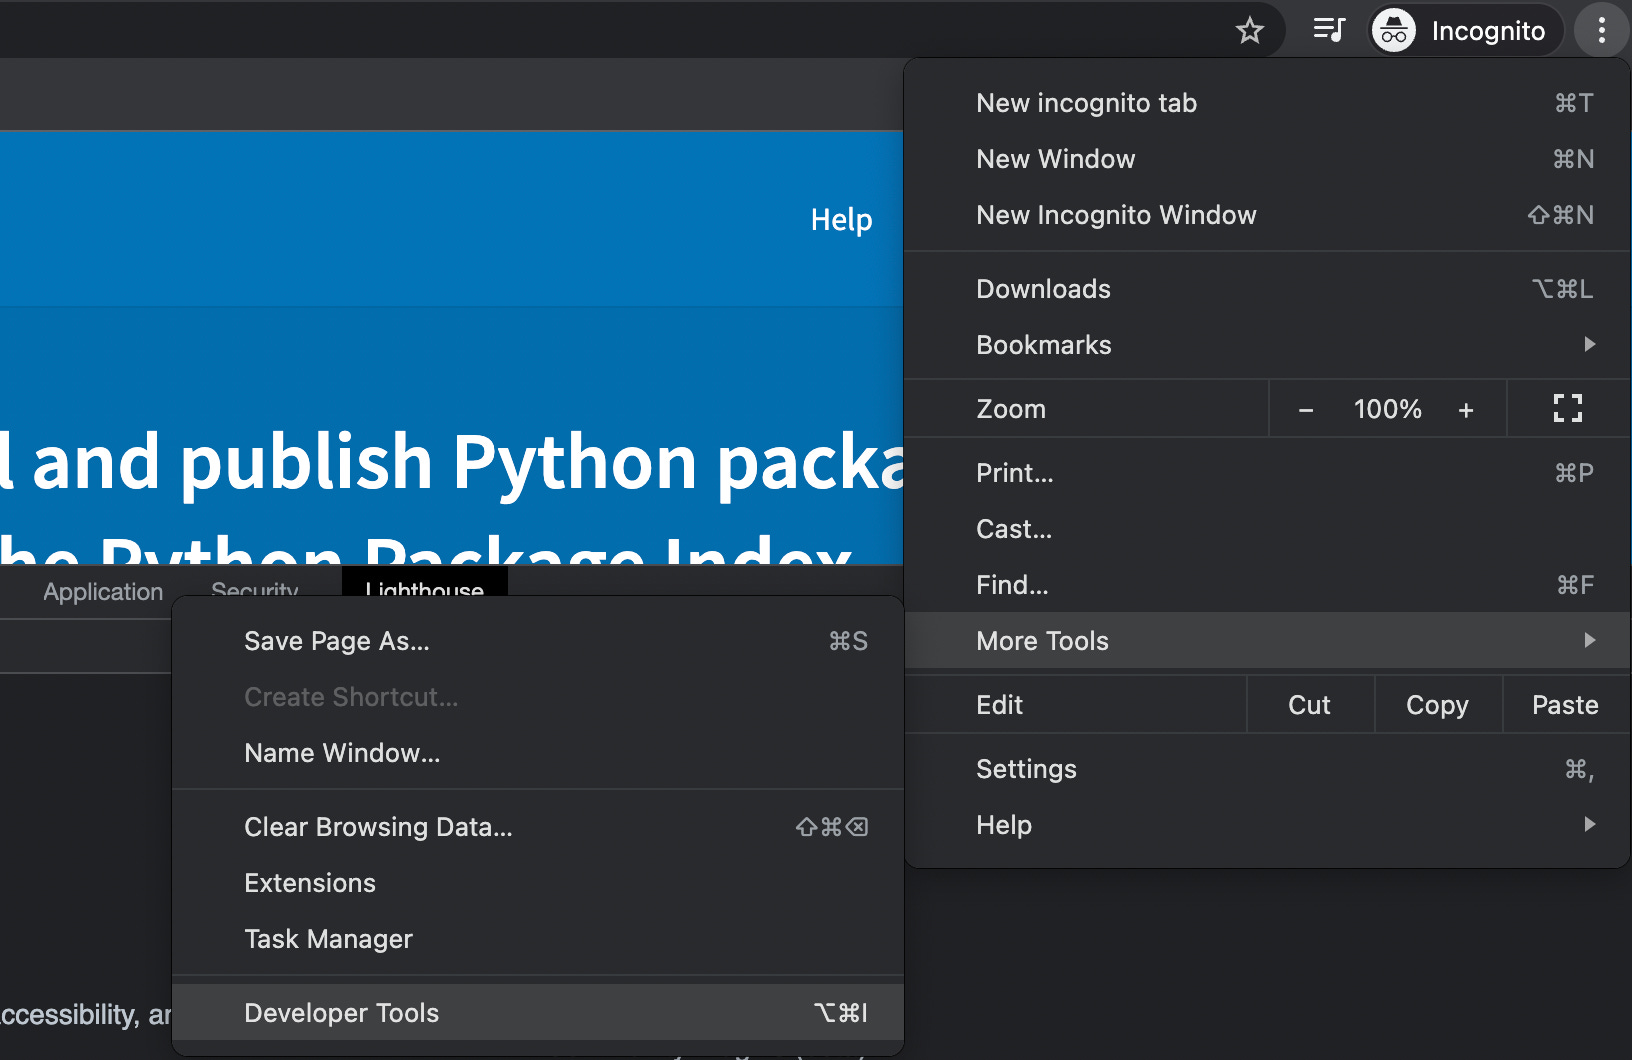
There are multiple tabs in this. The one which we are primarily focusing on today is Networks tab.
Let’s take an example of a website to understand the use case better. I am using https://pypi.org/
1. Basics
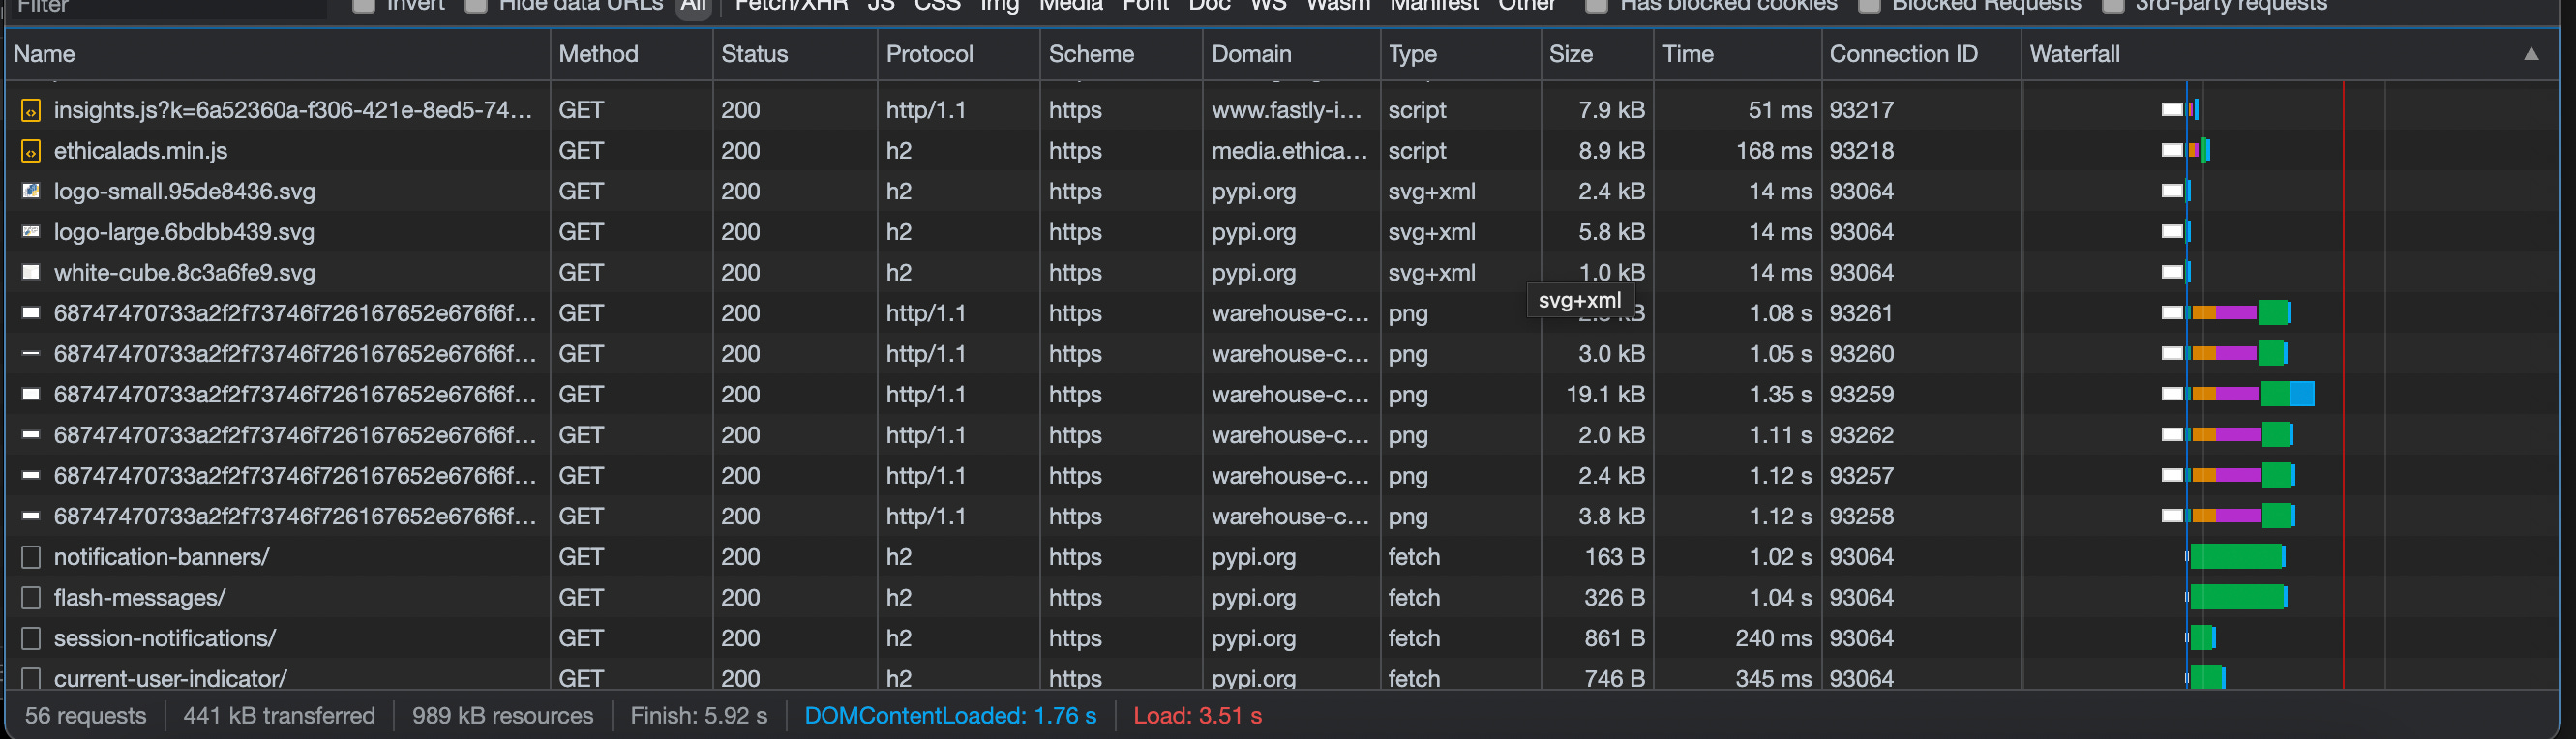
After you have opened the Developer tools, visit the Network tab and load https://pypi.org/
Once it’s loaded you should be able to see a table of requests. There are a bunch of default headers in the table. You can choose more by right clicking on the header and choose what you want to view/hide.

You can also apply filters on requests. For e.g. if you want to only see XHR requests then you can choose the filter for the same.

2. Understanding the Waterfall chart
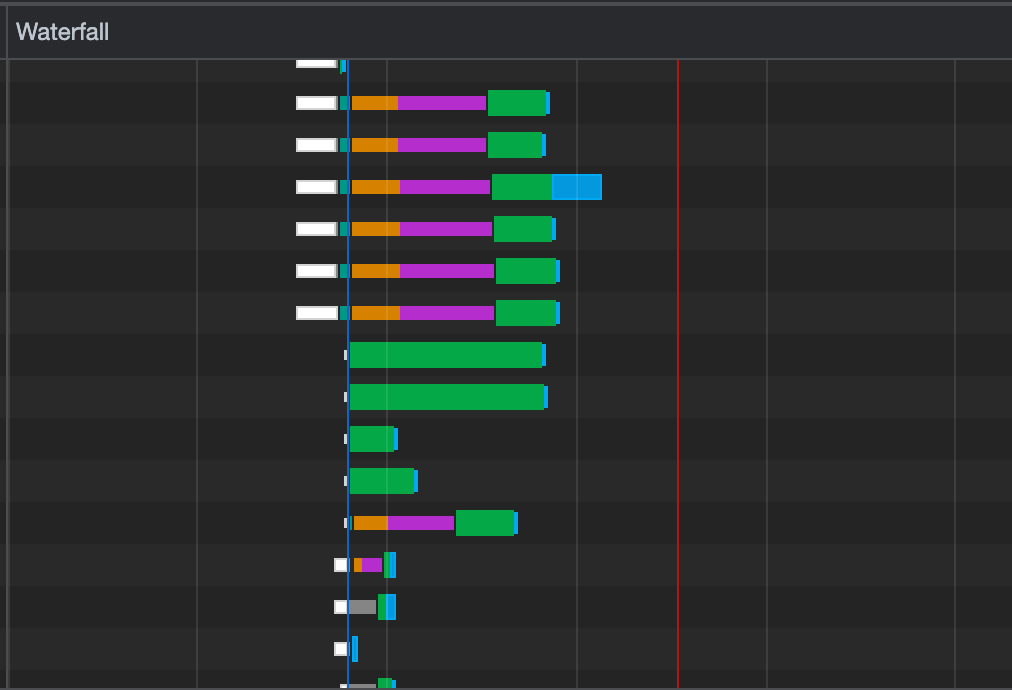
One of the headers in the networks tab is the Waterfall.
Usually you might ignore it but trust me, it can give you a lot of information about your website.
So what does waterfall tab show you?
1. This shows how long each request is taking and what is the overlap between them.
2. It can show you which of your requests are parallel and which are sequential.
3. It can also show different phases your request is going through.
Let’s hover over one of the requests in the Waterfall tab and see how it breaks down the request.
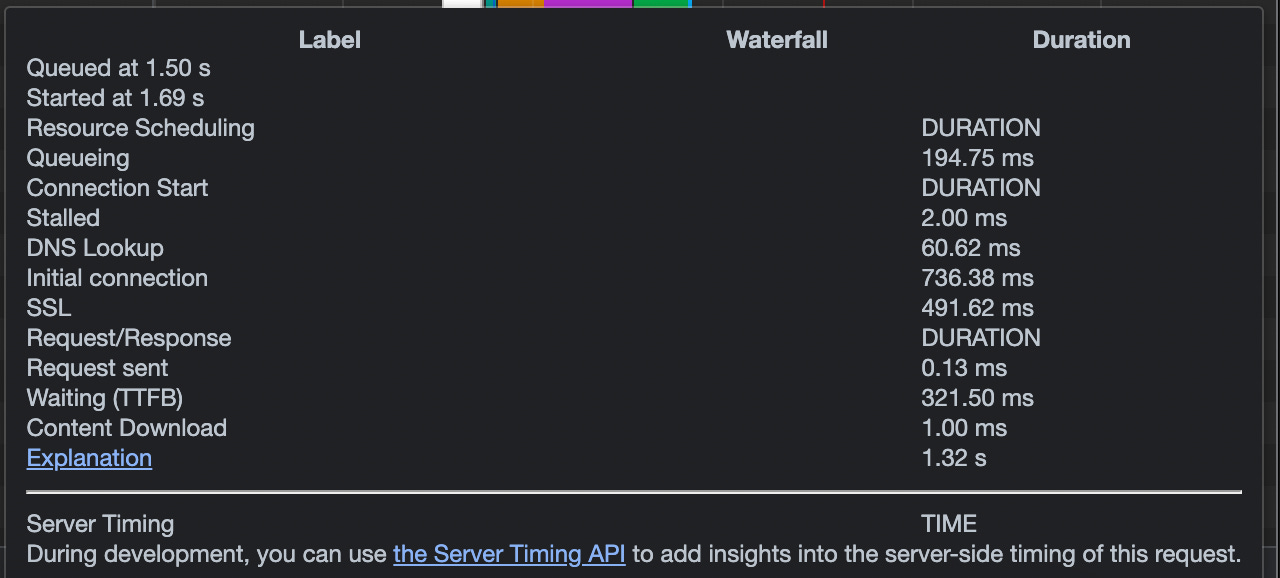
1. Queuing:
This shows how much time it was waiting in the queue. Now, why is your request queued?
There are higher priority requests.
There are already six TCP connections open for this origin, which is the limit. Applies to HTTP/1.0 and HTTP/1.1 only.
The browser is briefly allocating space in the disk cache
Source: https://developer.chrome.com/docs/devtools/network/reference/#timing-explanation
How to use this info?
1. You will have to see how many of your requests are queued and for how long. If that’s a huge number then you will have to optimise them so that they aren’t waiting for so long in queue.
2. Google Chrome queues your requests based on the priority of the request. You can see the priority of the request if you enable the *Priority* header of the table. Let’s say you have a particular JS file which needs to load first but its priority is shown as low, you can change it using the following syntax
<script src="/js/app.js" defer importance="high"></script>
Source: https://developers.google.com/web/updates/2019/02/priority-hints
2. Waiting (TTFB):
TTFB stands for Time To First Byte. Basically it shows how long it took between the browser sending the request and the browser receiving the first byte of the response. The reason we are only taking into account the first byte is because we don’t want this to be dependent on the size of the content being returned.
How to use this info?
Check if any of your requests are having a high TTFB. Dive deep and debug what is causing this delay. It can be your content, or it can be an issue on the server end.
3. Content download:
This shows how long it took to download the content completely on the web browser. This will depend on the size of the content and the internet bandwidth.
How to use this info?
If you find any requests which is taking long to download, try to cache them.
3. Are you using http1.1 and http2? 🤔
Pay attention to the protocol header. Simply put, it shows you if are using http1.1 protocol or http2(h2) protocol. Here’s why it’s important
http2 is fast in a lot of ways. It uses mechanisms like header compression, multiplexing etc. to optimise the requests. Make sure most, if not all, of your requests are using http2.
http1.1 can use a single TCP connection for only one request, but http2 can use it for multiple requests performed parallelly, which leads to faster loading. If you look under the connection header, you will notice that connection IDs of many http2 requests are same, but most http1.1 requests carry different connection IDs. This means that http1.1 has to establish separate connections for all these requests. There is a connection overhead for every request (SSL verification, DNS lookup etc). On the other hand http2 reuses the existing connection and avoids this.
If you compare the waterfall model for a set of http2 requests and http1.1 requests, you will be able to see the parallelisation which occurs in the requests.
Size header
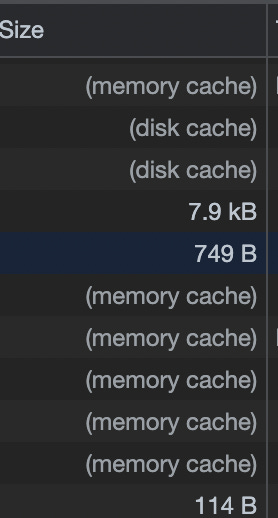
The size header will show you how big the request is. Keep a check on this to see if any of your requests are showing heavy bandwidth usage.
The size header also shows you if the content was prefetched from the cache. While requests which are dynamic would be fetched from the server, static assets which are huge can be stored on the browser. Make sure that your requests with heavy payloads are cached.
Wrapping up
This is a small peak into the plethora of information that the Developer tools can show you. Understanding it will help you serve your customers better. User experience starts with load speed and reaction time. Make sure the user is able to see the things he is looking for as soon as it’s possible.
Thanks for reading! 😃